epok
Incident intelligence across your telemetry

Turn alert cascades into
one evidence-backed incident.

Epok watches logs, metrics, traces, infrastructure, and RUM across the systems involved, detects emerging failures, groups the cascade, and separates the trigger from the sustaining cause. Every committed conclusion links to source evidence; when the evidence cannot support one, Epok abstains.

self-service or governed evaluation · shadow mode · no cutover · review the governed plan →

Keep your current alerts unchanged No autonomous production changes Committed claims link to source evidence When the evidence is thin, it says so
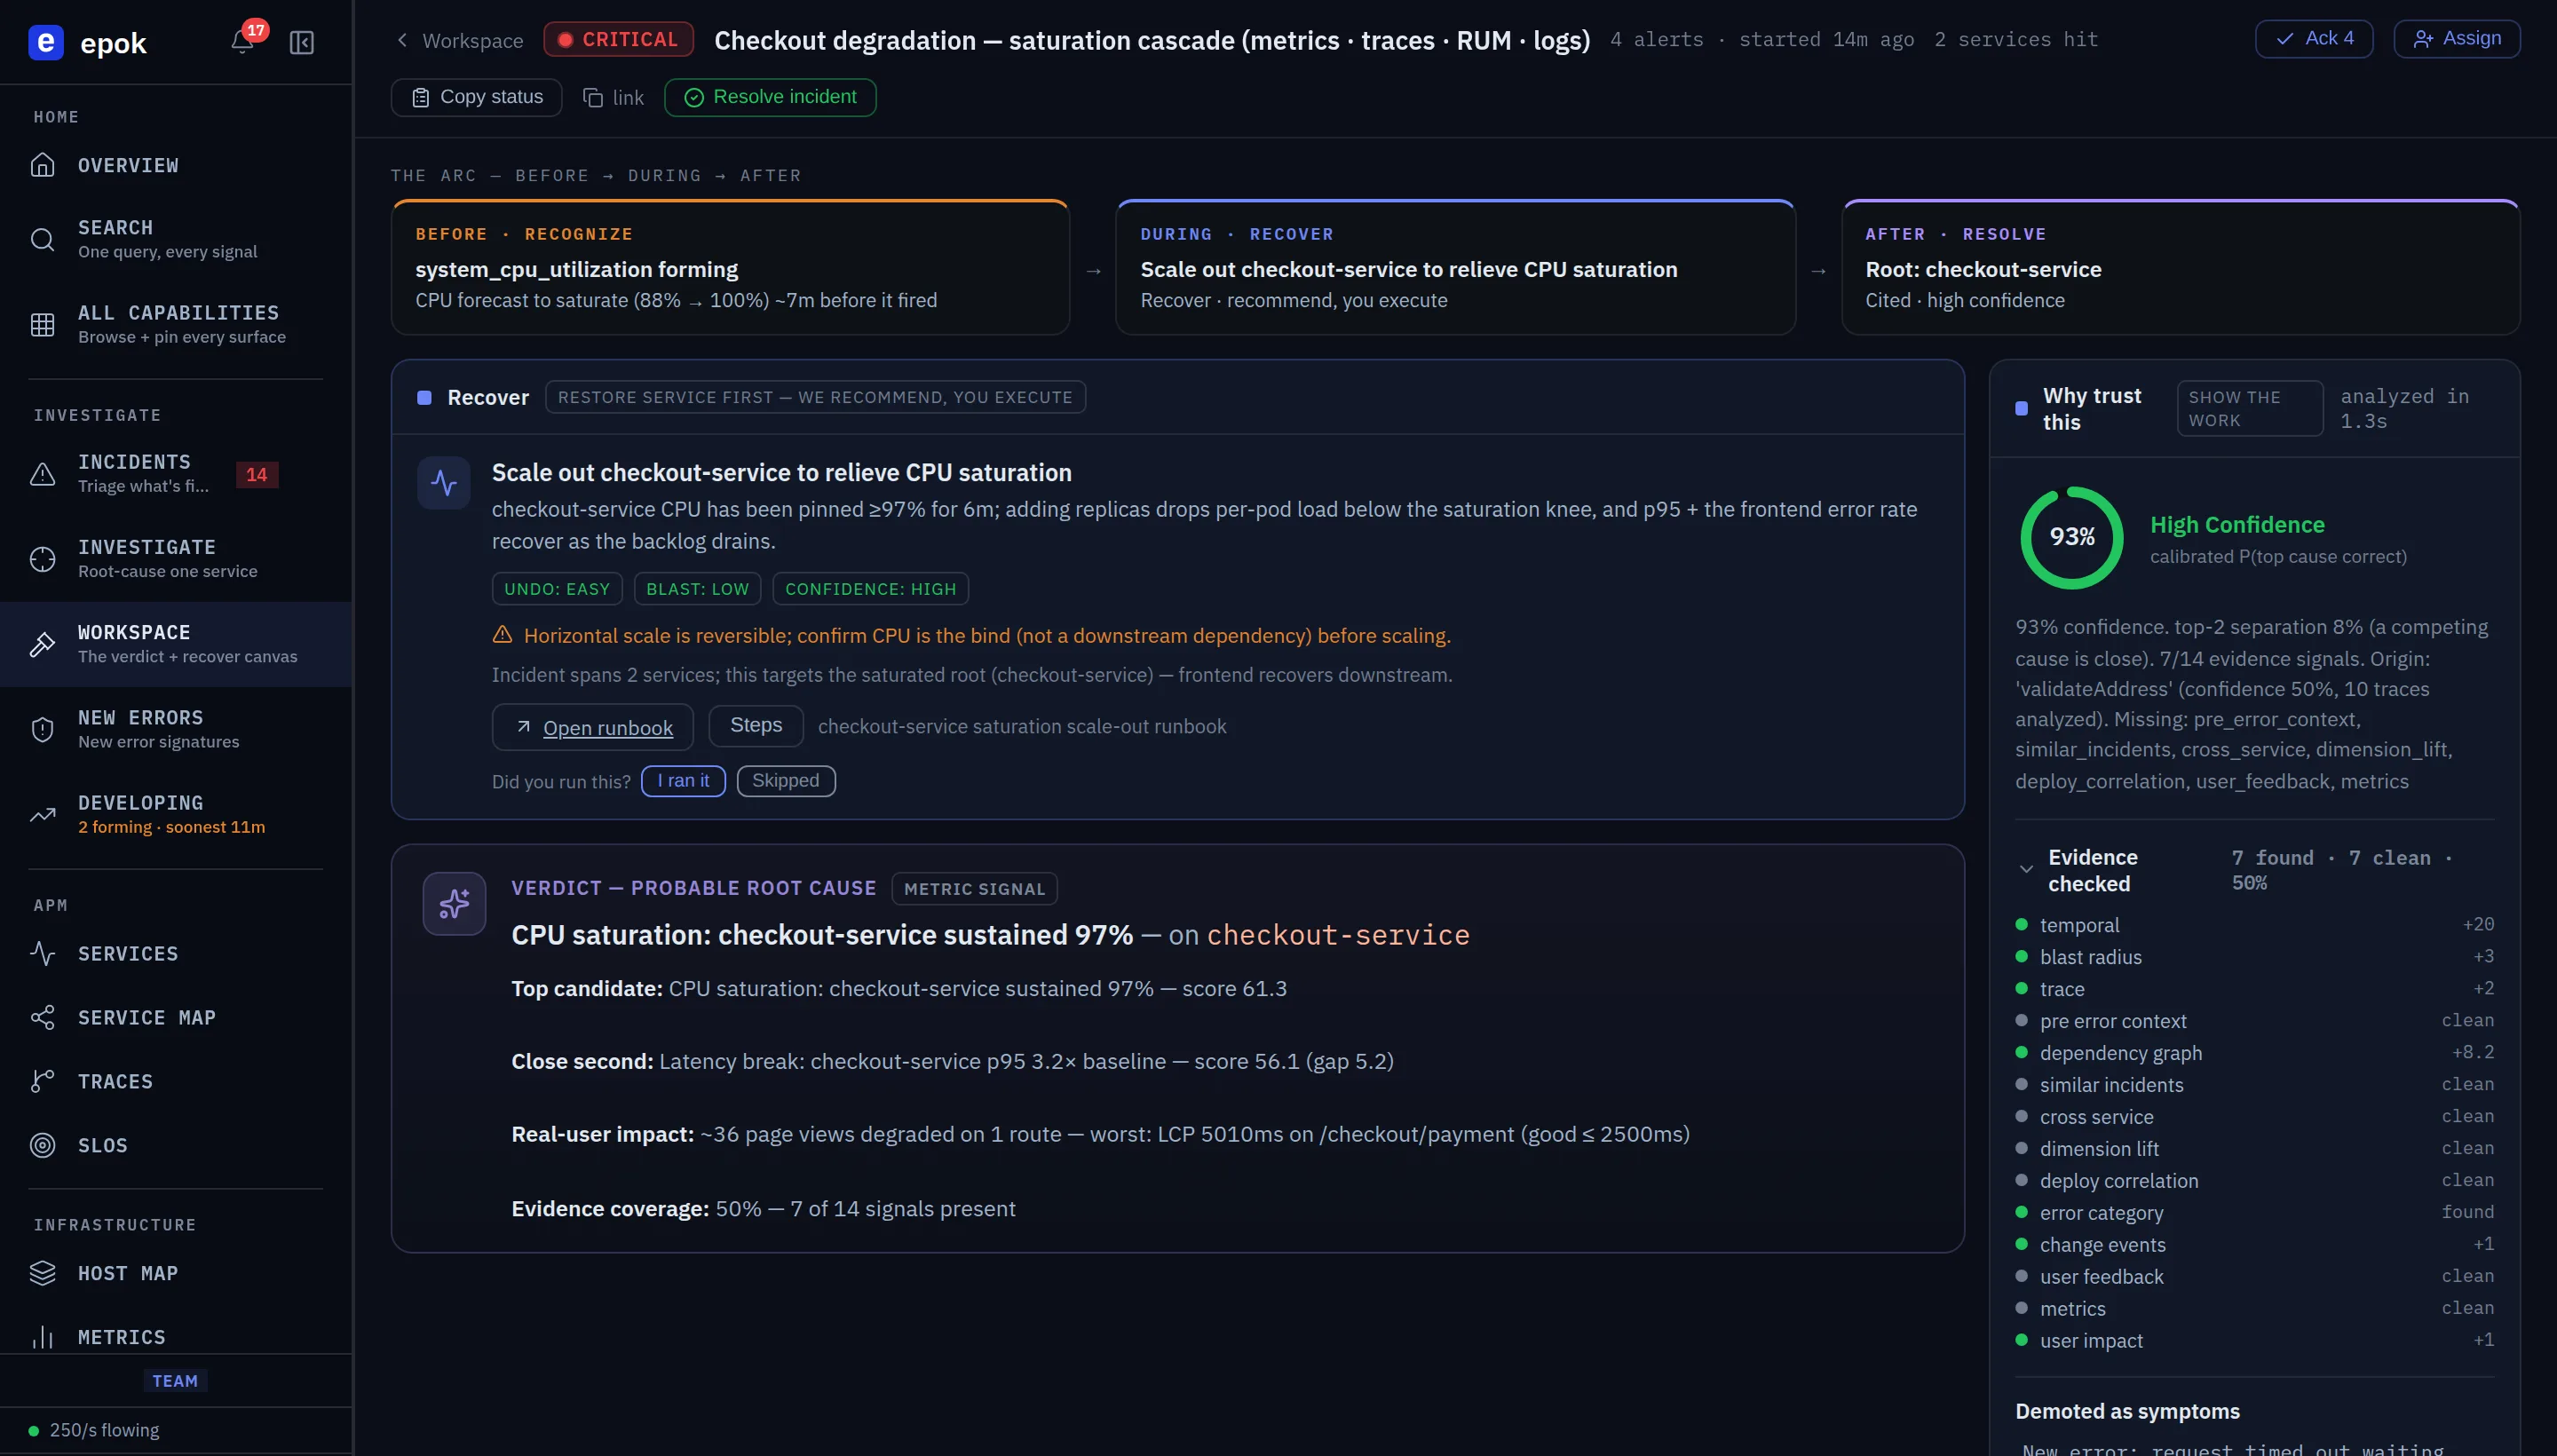
The Epok incident workspace: a checkout saturation cascade with the Before/During/After arc, a reversible recovery recommendation, and a cited root-cause verdict at 95% calibrated confidence the live demo — this exact screen, no signup →
The operational loop

Detect. Group. Explain. Deliver one incident.

Keep Datadog, New Relic, ClickHouse, or your current search layer for storage and queries. Epok runs the incident loop around that telemetry without becoming part of your production request path.

01

Detect

Immediate rule packs match supported failure evidence as it arrives. Learned detectors establish service cadence and baselines from history.

02

Group

Related alerts, services, traces, infrastructure signals, and—when present—deploy and user-impact context align into one incident timeline.

03

Explain

Epok separates the initiating trigger from the condition sustaining the failure, then cites the lines, spans, or metrics behind a committed cause.

04

Deliver

Slack, PagerDuty, email, or a webhook receives one incident with evidence and, where supported, a reversible response recommendation. Responders execute.

telemetry → detector → correlated incident → evidence-gated verdict or abstention → responder notification
See every detector and its history requirement →Open the resulting incident →
Before → During → After

One incident, three tenses — one engine.

One real incident, worked end to end — a retry storm holding a service down 14 minutes after its trigger cleared. The same incident is open in the live demo.

IMMINENTqueue_utilization · checkout
now 81%saturation in ~12m
BEFORE · Recognize
Recognize

The request queue is accelerating toward saturation. Epok forecasts the breach, with live ETA and confidence shown, 12 minutes before anything pages.

RECOVER· we recommend — you execute
Shed load: disable client retries
UNDO · EASYBLAST · MEDIUMCONFIDENCE · HIGH
⚠ Rollback won't recover this — nothing failing was deployed.
DURING · Recover
Recover

The counterintuitive right move: shed the retries. And the guard that matters — rollback will NOT recover this. We recommend; you execute.

VERDICT· cited · filed ✓
TRIGGER · CLEARED40s packet loss, self-resolved
SUSTAININGretry policy — ×4.2 offered load
last deploy exonerated · every claim linked to its line
AFTER · Resolve
Resolve

The verdict separates the trigger (a 40s blip, cleared) from the sustaining cause (the retry policy) — cited, with the last deploy exonerated.

before · during · after — one incident, worked end to end · 2:00
THE VERDICT THAT ADMITS WHEN IT DOESN'T KNOW

It commits when the evidence is there. When it isn't, it says so.

AI assistance is only useful if responders can distinguish evidence from fluency. Epok can abstain and show why the available signals do not support one cause. Use the trial to inspect both cases: committed verdicts and honest "not enough evidence" outcomes.

COMMITTED
Root cause: checkout-service CPU saturation, sustained 97%. Cited to the metric + the two spans that corroborate it.
ABSTAINED
"Three candidates are close and none dominates — committing to one would be a guess, and we don't guess." Here are the three, ranked, with what each is missing.
The demo publishes its own scorecard — committed vs abstained, last 90 days, on every verdict. See the live track record →
Capability readiness

Automatic where it can be. Explicit about what needs context.

The input requirement matters as much as the feature name. Here is what each result needs before an SRE should expect it.

IMMEDIATE

Rule-pack detection

Needs: Supported logs, events, or metrics with service and environment context.

Produces: Can match the first supported failure event; no baseline-training window.

verify capability →
LEARNS

Behavior and silence detection

Needs: Enough volume or cadence history to establish what is normal for the service.

Produces: Baselines sharpen over the first week; learned detection stays gated while the required history is insufficient.

verify capability →
AUTOMATIC

Incident grouping

Needs: Stable service, environment, and timestamps; trace and deploy context improve the links.

Produces: Related alerts and downstream symptoms collapse into one incident chain.

verify capability →
EVIDENCE-GATED

Probable cause

Needs: Enough corroborating logs, spans, metrics, or infrastructure evidence in the incident window.

Produces: Commits with citations when supported; ranks candidates and abstains when it is not.

verify capability →
WHEN WIRED

Customer impact

Needs: A customer identifier in telemetry and, optionally, an account or tier roster.

Produces: Shows affected accounts and tiers beside the technical incident evidence.

verify capability →
WHEN WIRED

Trace-linked replay

Needs: Browser replay instrumentation plus shared trace context between browser and backend.

Produces: Opens the relevant replay at the failure moment from the trace that broke.

verify capability →
Technical proof

Check the implementation. Not just the headline.

The public demo uses synthetic, production-shaped data. Use these surfaces to inspect the actual output, supported coverage, operational limits, and data path before connecting your own telemetry.

Evaluation paths

Self-service when you can. Governed when you need.

The controlled-evaluation plan is an option for environments that require it—not the minimum process for trying the product. In both paths, current paging remains authoritative and Epok makes no autonomous production change.

SELF-SERVICE

Start without a program

An on-call engineer can open a 14-day workspace with any work or personal Google account and no card. Keep every existing destination, dashboard, monitor, and page unchanged.

GOVERNED

Bound the data path

A platform or security team can approve a representative production boundary, selected fields, expected volume, an ingest-scoped key, and an independent queue, retry policy, and ceiling.

DECISION

Score the incident cohort

Classify correct, incorrect, abstained, and missed outcomes. Compare alert fanout, time to verified cause, coverage, and responder effort; then expand, coexist, or stop.

Start self-service — no cardRequest a governed evaluationReview the complete plan →
server telemetry uses the open shippers you already run — browser RUM and replay use web instrumentation
Resolve · one investigation surface

The whole incident on one screen. No tab-hopping.

When an alert fires, Epok opens one canvas: the drafted root cause, what changed, the cascade timeline, the blast radius, and who's affected — every claim clickable back to the line, span, or metric behind it.

An Epok investigation on one canvas: a cited probable-cause verdict with a confidence score, blast radius across services and users, and the cross-service cascade timeline — every claim links to its evidence
read-only · every claim clickable back to the line, span, or metric · open it on the live demo →
session_replay · stitched to the trace

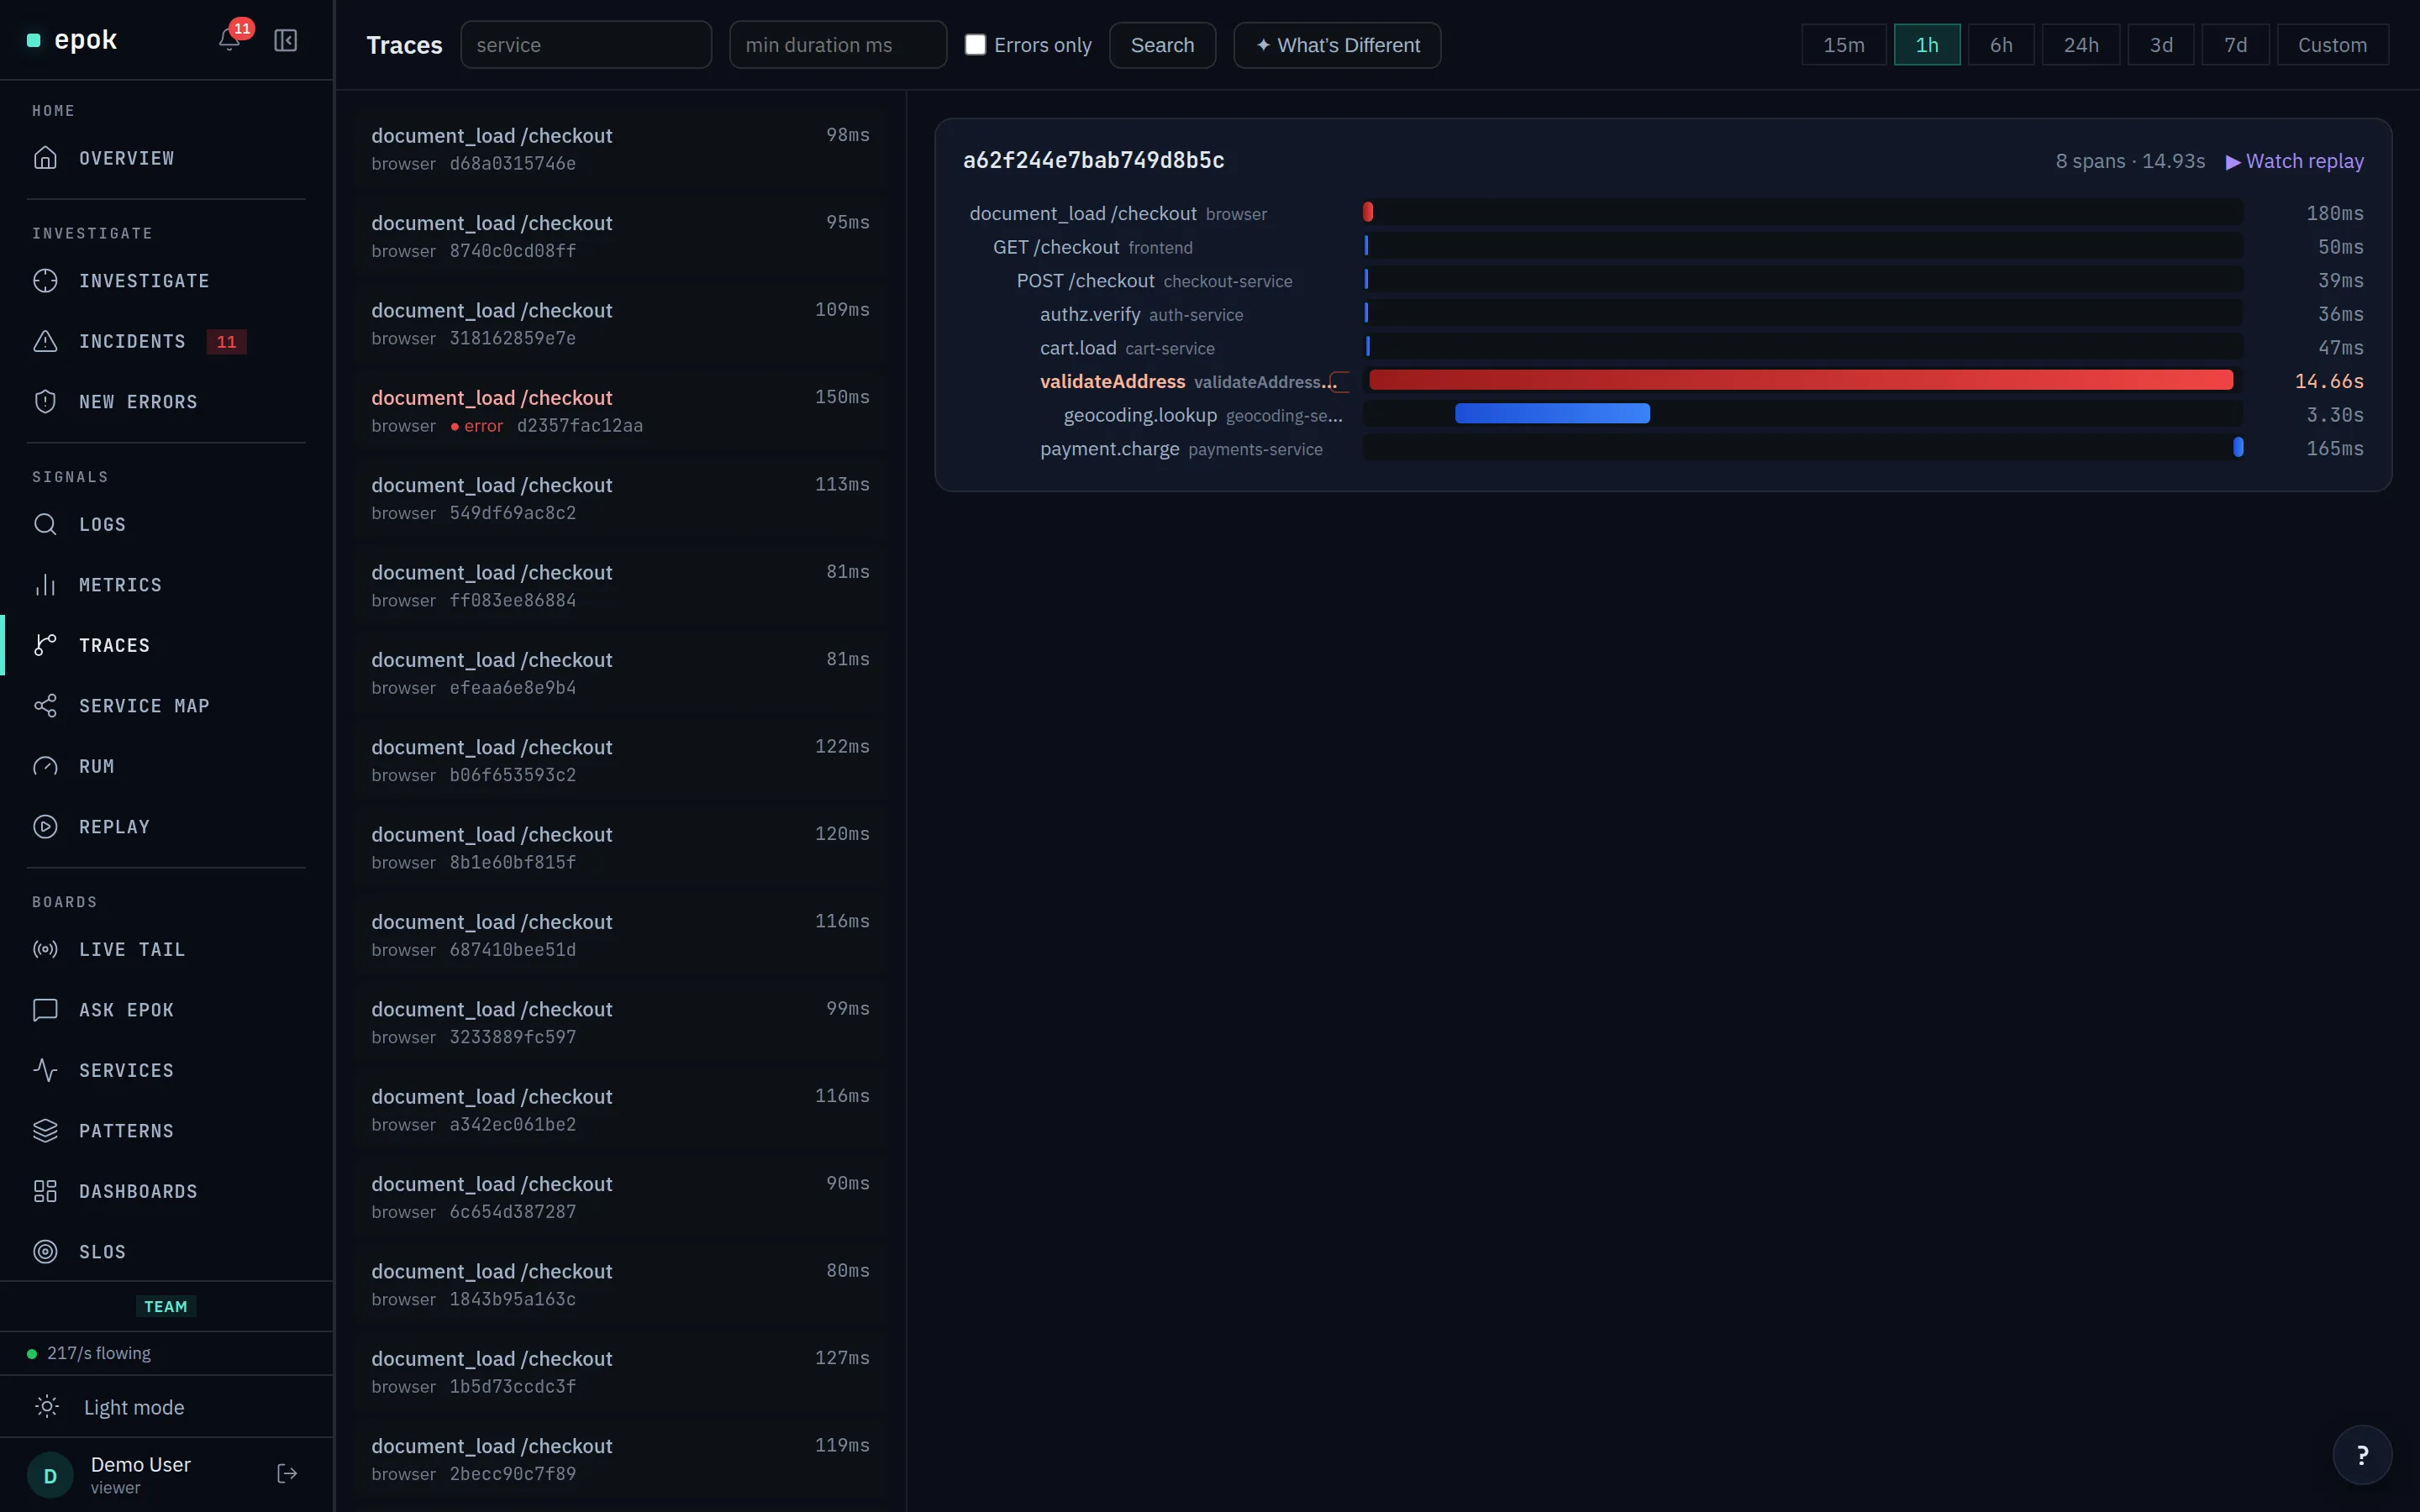
Watch the user hit the bug — from the trace that broke

When browser and backend instrumentation preserve shared trace context, a failing trace can open the associated replay at the failure moment. You inspect the user experience and backend path without cross-referencing two timestamps.

trace 69e9…2be4 · POST /checkout · 500▶ replay · seeked to 00:04 — "Payment failed"
RUM & Replay →
customer_impact

Customer impact where identity is present

Add a roster and emit a customer identifier. Relevant incident windows can then show affected accounts and tiers beside the technical evidence.

0Enterprise0Pro0Free
wire it — paste a roster, done →
ask_epok

Plain English → search

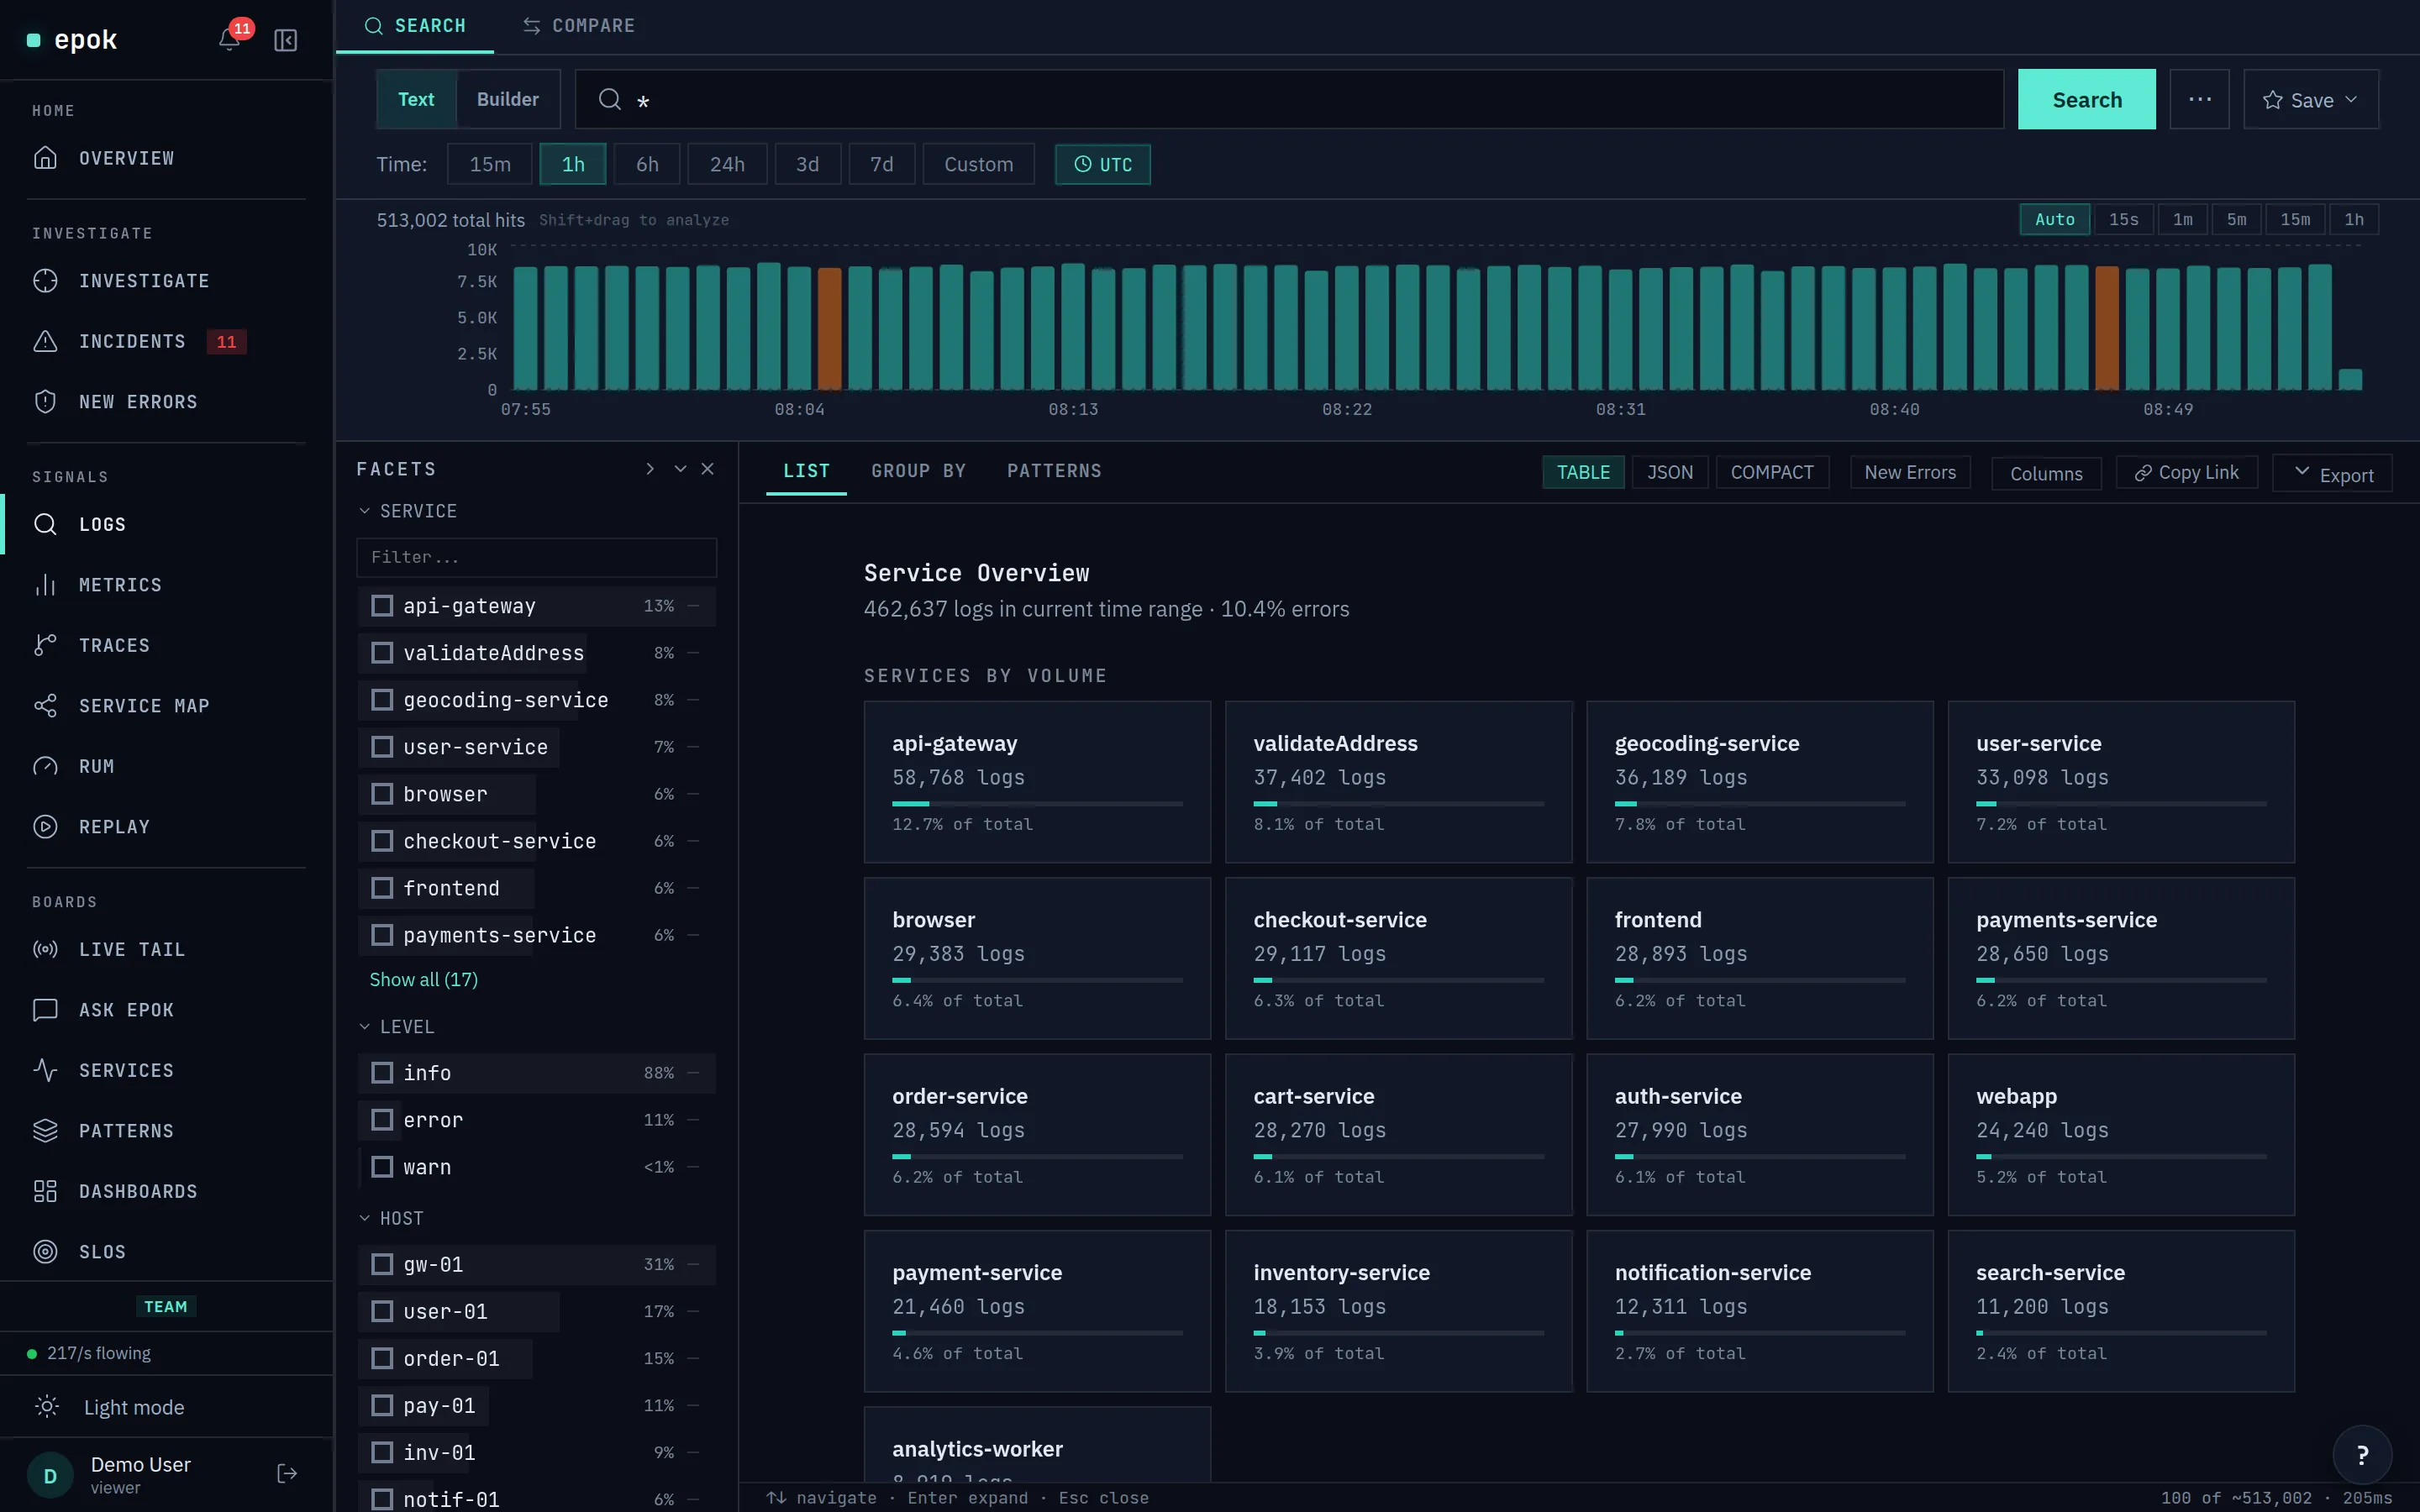
Type "why is checkout slow in the last hour." AI translates it to a query, a 42-test validator forces time + limit, then we run it. Query is ground truth; the explanation sits beside it.

› why is checkout slow in the last hour
→ search svc=checkout p95>1s | last 1h | limit 500
postmortem

Postmortem draft, the moment it resolves

When the incident closes, a draft appears — triggering signal, cited evidence chain, matched playbook, and customer-impact rollup, pre-assembled. You edit; you don't author from a blank page.

triggerevidenceplaybookimpact
playbook_match

Your runbooks, matched — not authored

Bulk-import from Confluence, Notion, GitHub, or Markdown. A citation engine surfaces the best-matching runbook — the specific steps land inside Slack, PagerDuty, and the deep RCA, not a link to a wiki.

payment-pool exhaustion → 3 steps inlined in PagerDuty
Recognize · what it catches

Catch what actually pages you.

An error you've never seen

Surfaces messages that never appeared in your recent history — the first sign of a fresh failure.

payment-service: "FATAL: connection pool exhausted" — first seen
COLD-START · ready within your first week

A service gone quiet

Catches a service that stops logging when it normally logs steadily. Failure with no error — just absence.

worker-billing went silent — last log 6m ago (normally 30s)
COLD-START · ready within your first week

Spikes, drops, flatlines

Flags volume that jumps, falls, or flatlines against each service's daily and weekly normal.

api: 12,400 lines/min vs 3,200 normal (× 3.9)
COLD-START · learns your normal

Many errors, one root

Groups errors that share a shape, so dozens of variants land as a single alert.

84 variants of one failure folded into 1 alert
COLD-START · active immediately

Crashing workloads

Surfaces crash loops, out-of-memory kills, and unschedulable workloads straight from their logs.

billing-7c4b out-of-memory — 3rd restart in 4m
COLD-START · can match the first supported event

Failures that cascade

Connects upstream failures, retries, and circuit-breaker trips into the cascade they cause.

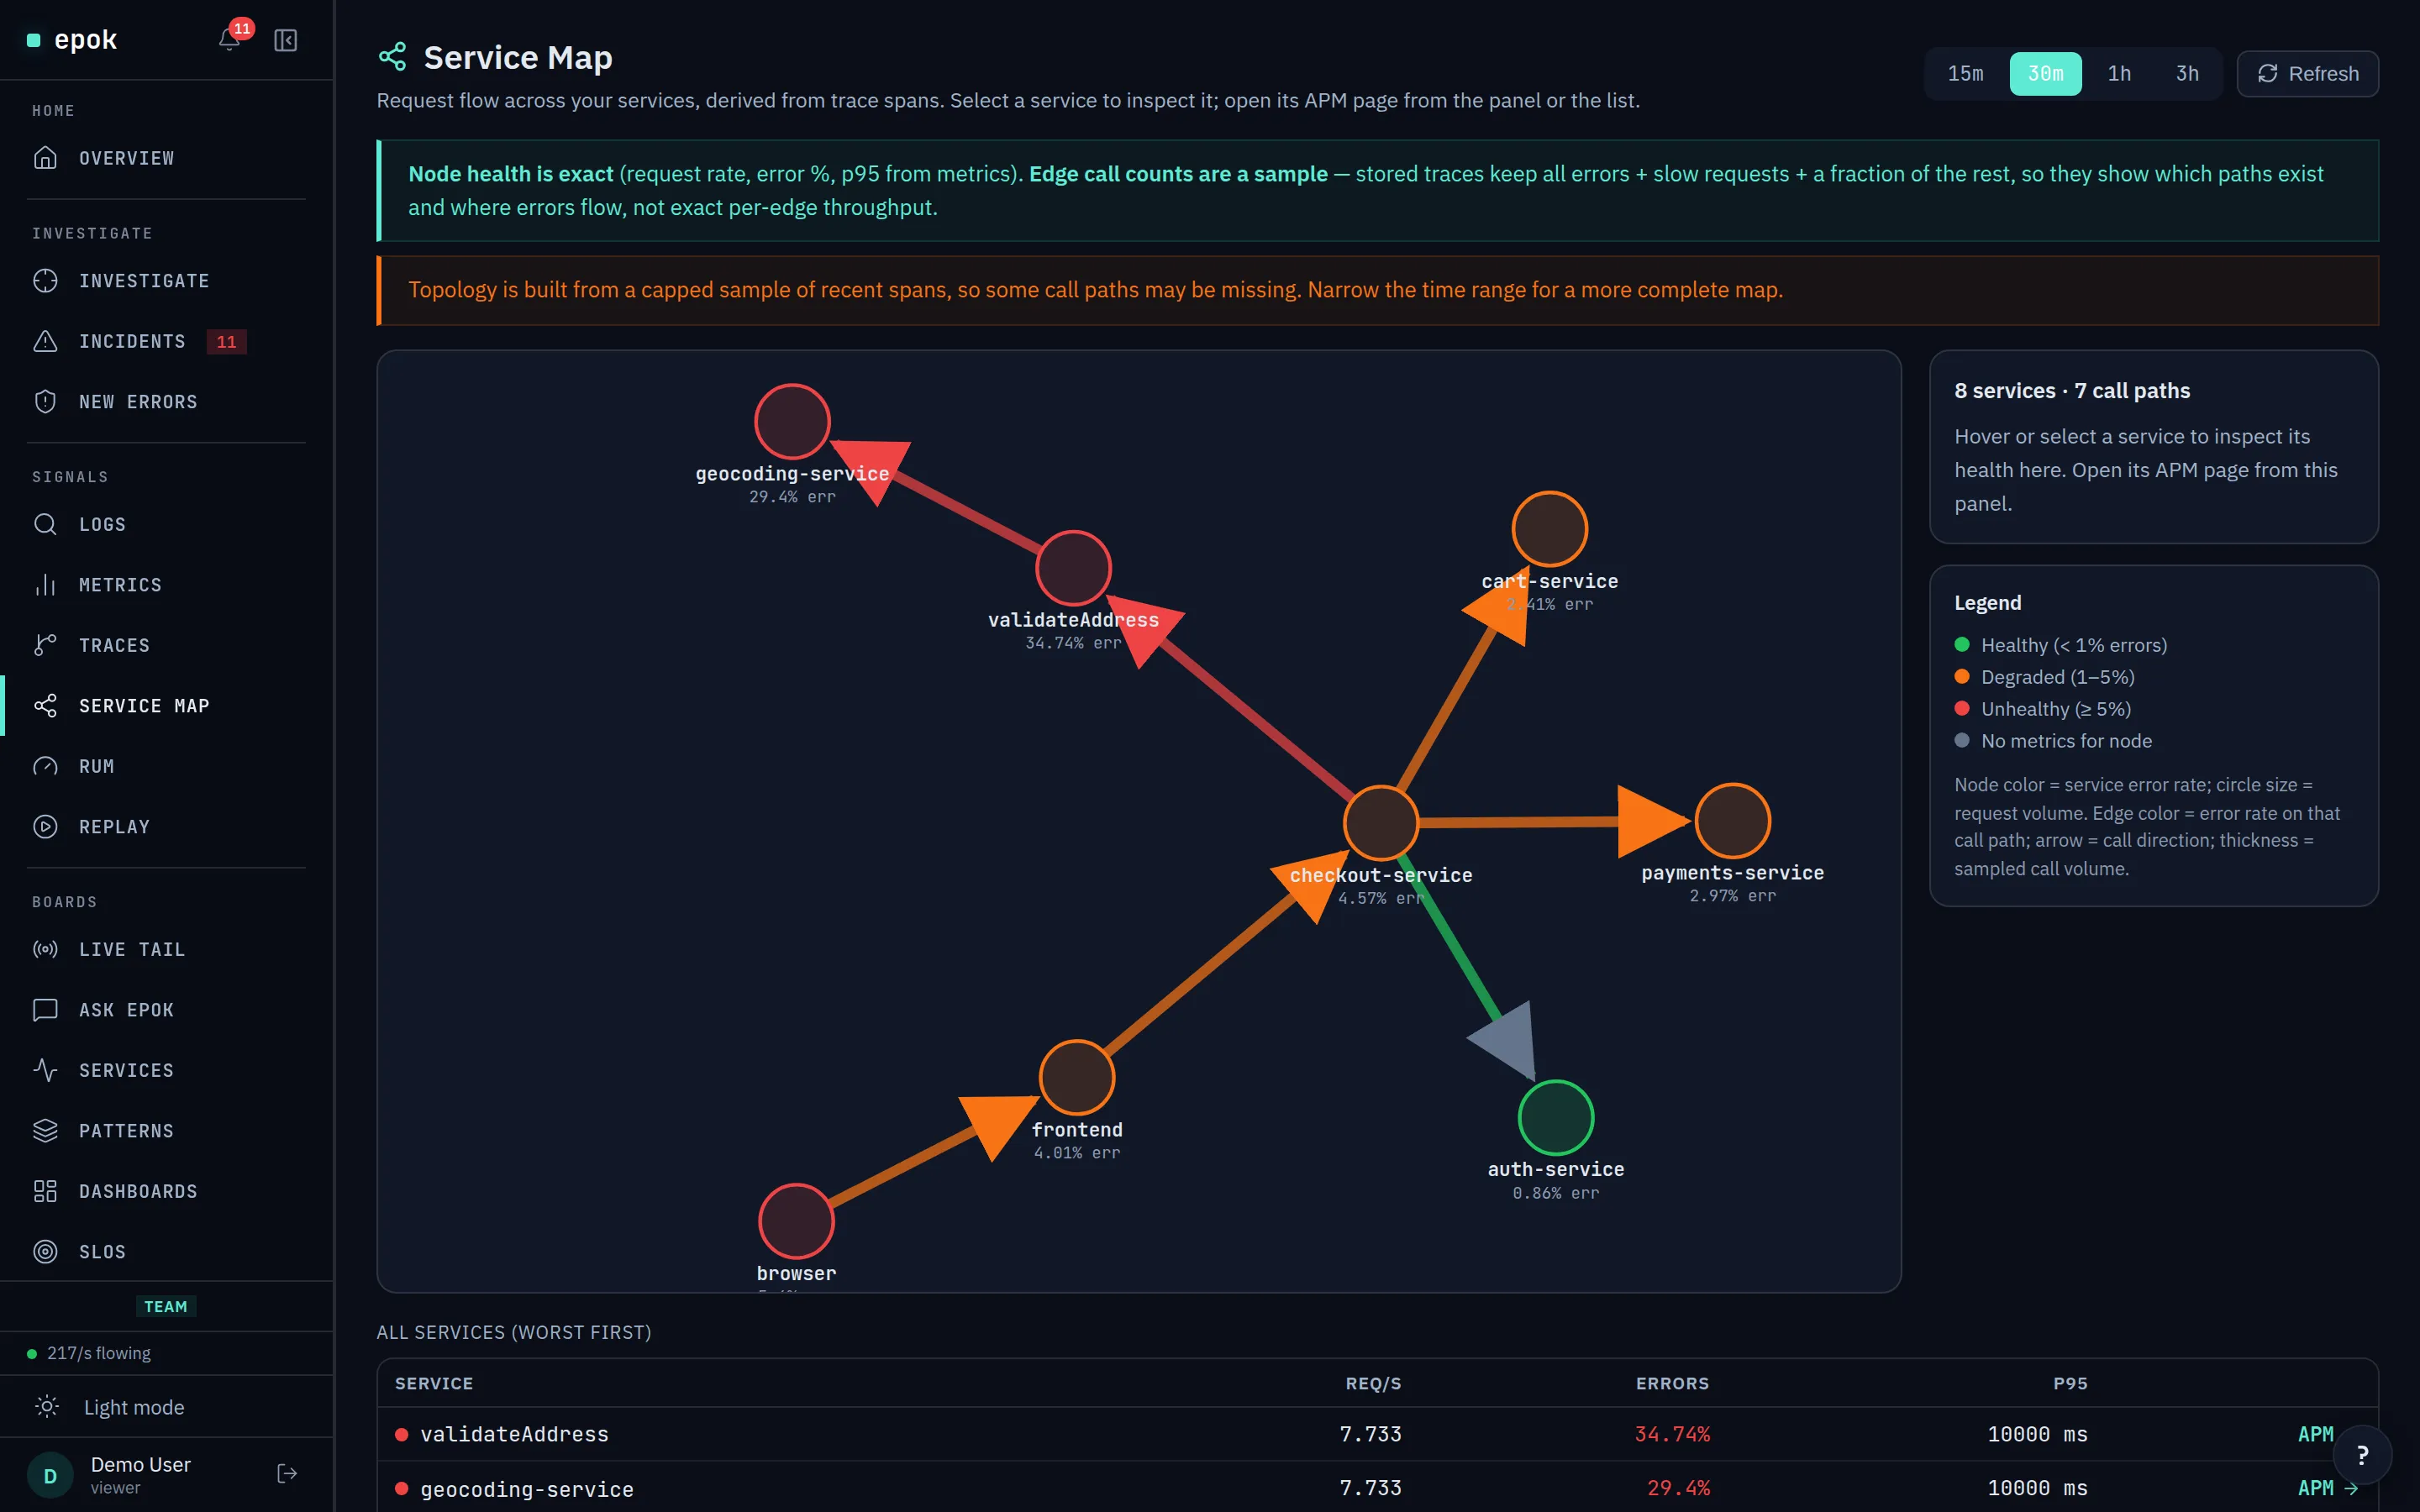
3 services blame one upstream — cascade in 8s
COLD-START · can match arriving evidence

One incident. Not fifty alerts.

The pager is rationed by design. Repeats collapse, cascades arrive as one chain, and severity rides explicit thresholds the product enforces.

01

Fingerprint dedup

Alerts with the same semantic fingerprint collapse into one alert with a fire count.

02

Incident grouping

Correlated signals can arrive as one incident chain: db silent → API refused → frontend 502s.

03

Dynamic suppression

Repeat fires de-escalate on a widening window. New shapes still get full severity.

04

Severity rationing

Critical / Warning / Info on explicit thresholds the product enforces.

Live demo · no signup

See it on data. No signup.

A 5-service app generates a continuous synthetic log stream into a public Epok tenant. Anomaly detection, RCA, and clustering run on it live — Epok working on real-shape data, not a marketing video.

alerts inboxlive
CRIT
connection pool exhausted
payment-service · first seen · 3-svc cascade
WARN
service went silent — 6m
worker-billing · normally logs every 30s
CRIT
out-of-memory — 3rd restart
billing-7c4b · crash loop · 4m
INFO
12,400 lines/min vs 3,200
api-gateway · × 3.9 normal
Pricing

One meter. No hidden SKU math. No cardinality tax.

One included-volume meter across logs, metrics, traces, infrastructure, RUM, and replay. Paid-plan overage is $0.20/GB and shown daily; there is no per-host, per-query, or cardinality line.

Trial
$0 / 14 days
  • Up to 1 TB · 73 GB/day cap
  • Every feature unlocked
  • No credit card
Start free →
Growth
$599 / mo
  • 4 TB / month · 30-day retention
  • Unlimited users · larger AI budget
  • Overage $0.20/GB · shown daily
Start Growth →
FAQ

Before you ask.

No. An on-call engineer can run the self-service trial, while a platform or security team can define a governed evaluation. Choose a representative service group, ownership domain, environment, or critical user journey; your current alerts and incident process remain authoritative throughout.

Ingest pauses, your data stays readable, and you add a card when you're ready. Nothing auto-charges.

Self-service signup accepts any personal or work Google account; it is not restricted to Google Workspace. Microsoft login, SAML enterprise SSO, and SCIM are not available today. If your organization cannot use Google, inspect the live demo without signup or request a governed evaluation.

Your plan price and included volume are fixed. Paid-plan overage is $0.20/GB and is shown in your dashboard daily; a documented safety ceiling limits runaway ingest. The trial cannot generate overage or a charge.

No. Log as many unique fields as you want; there is no per-series tax.

No. Detectors run automatically, and you can ask in plain English.

Send logs, metrics, traces, and infrastructure data with OpenTelemetry or an open shipper—there is no proprietary Epok agent for server-side telemetry. Browser RUM and replay use web instrumentation such as OpenTelemetry Web and rrweb.

Yes. Mirror a representative production boundary to Epok through a second OpenTelemetry or open-shipper path, and keep your current alerts unchanged. Compare both systems on the same incident windows before discussing any expansion or cutover.

SHADOW MODE · CONTROL PLANE UNCHANGED · EVIDENCE GATES

Keep your current platform.
Make Epok prove the incident outcome.

$ curl -X POST https://ingest.getepok.dev/v1/logs \
-H "Authorization: Bearer $EPOK_KEY" \
-d '{"service":"api","level":"info","msg":"hello"}'
# {"ok":true}